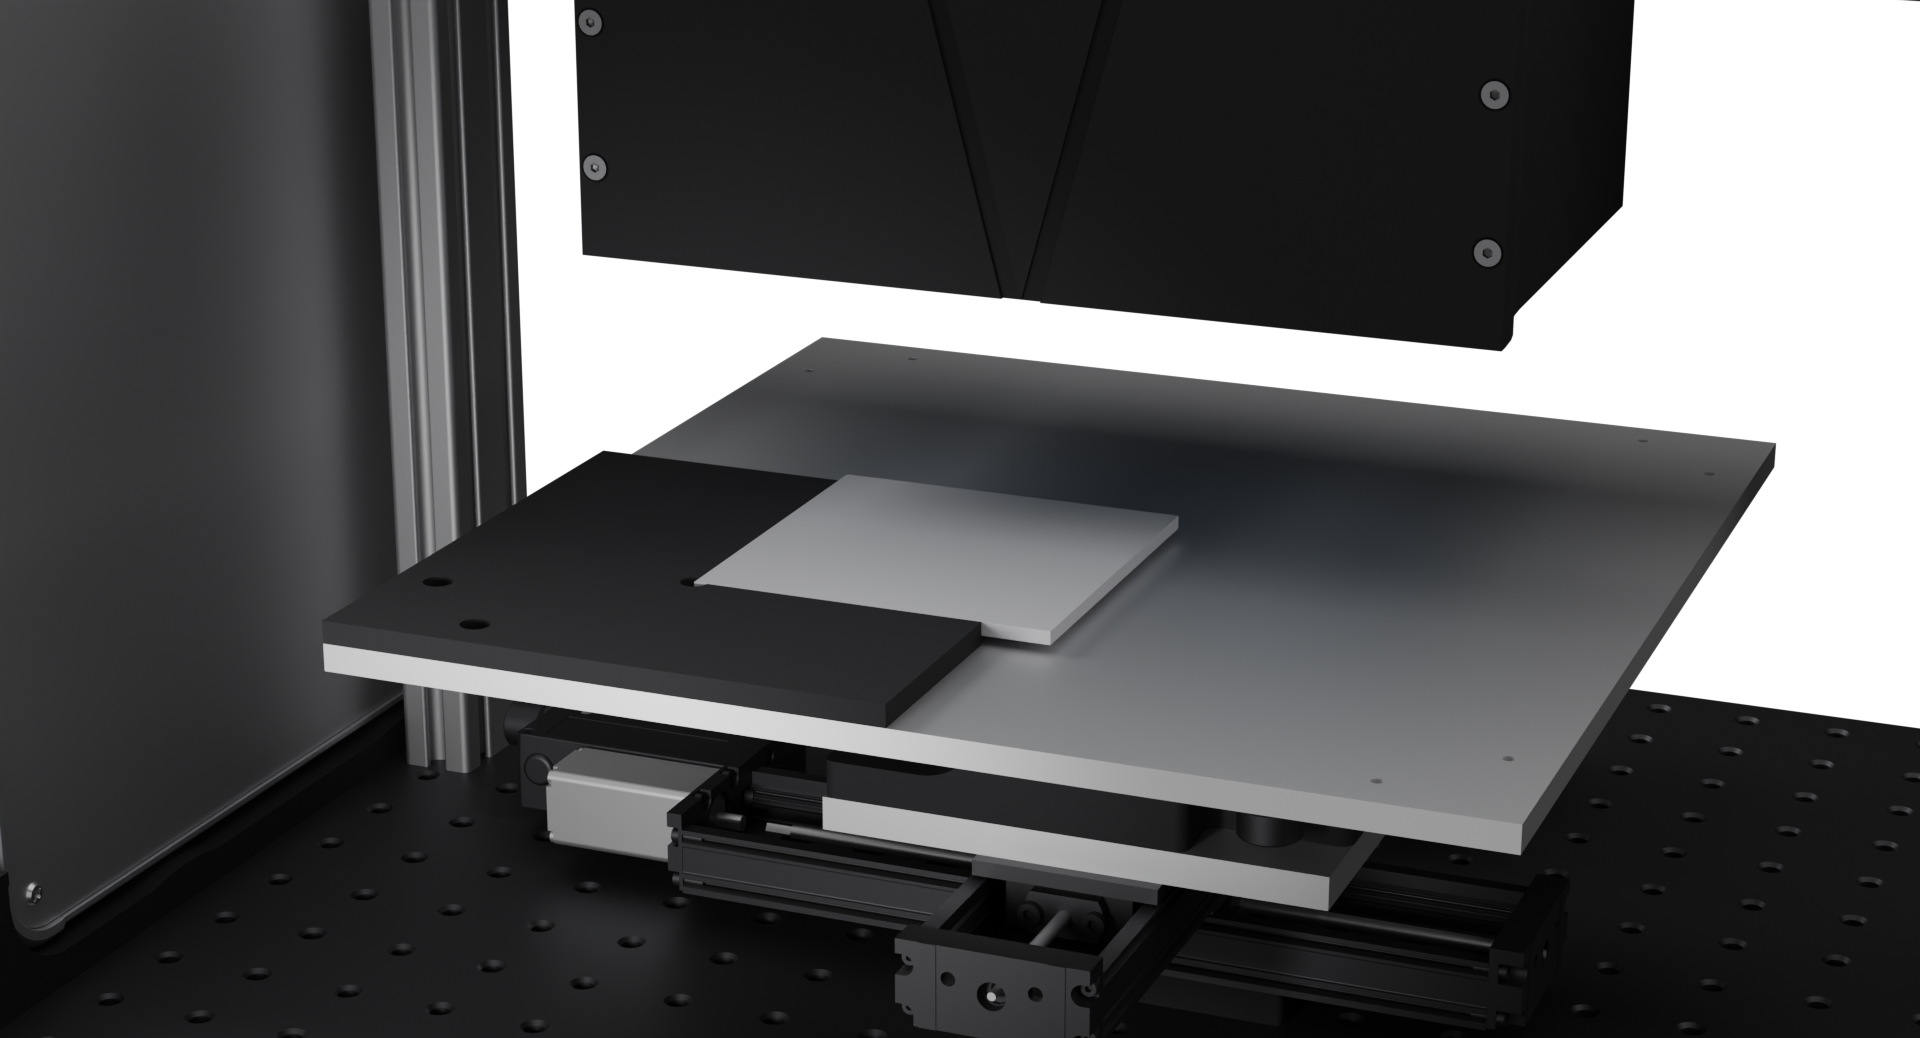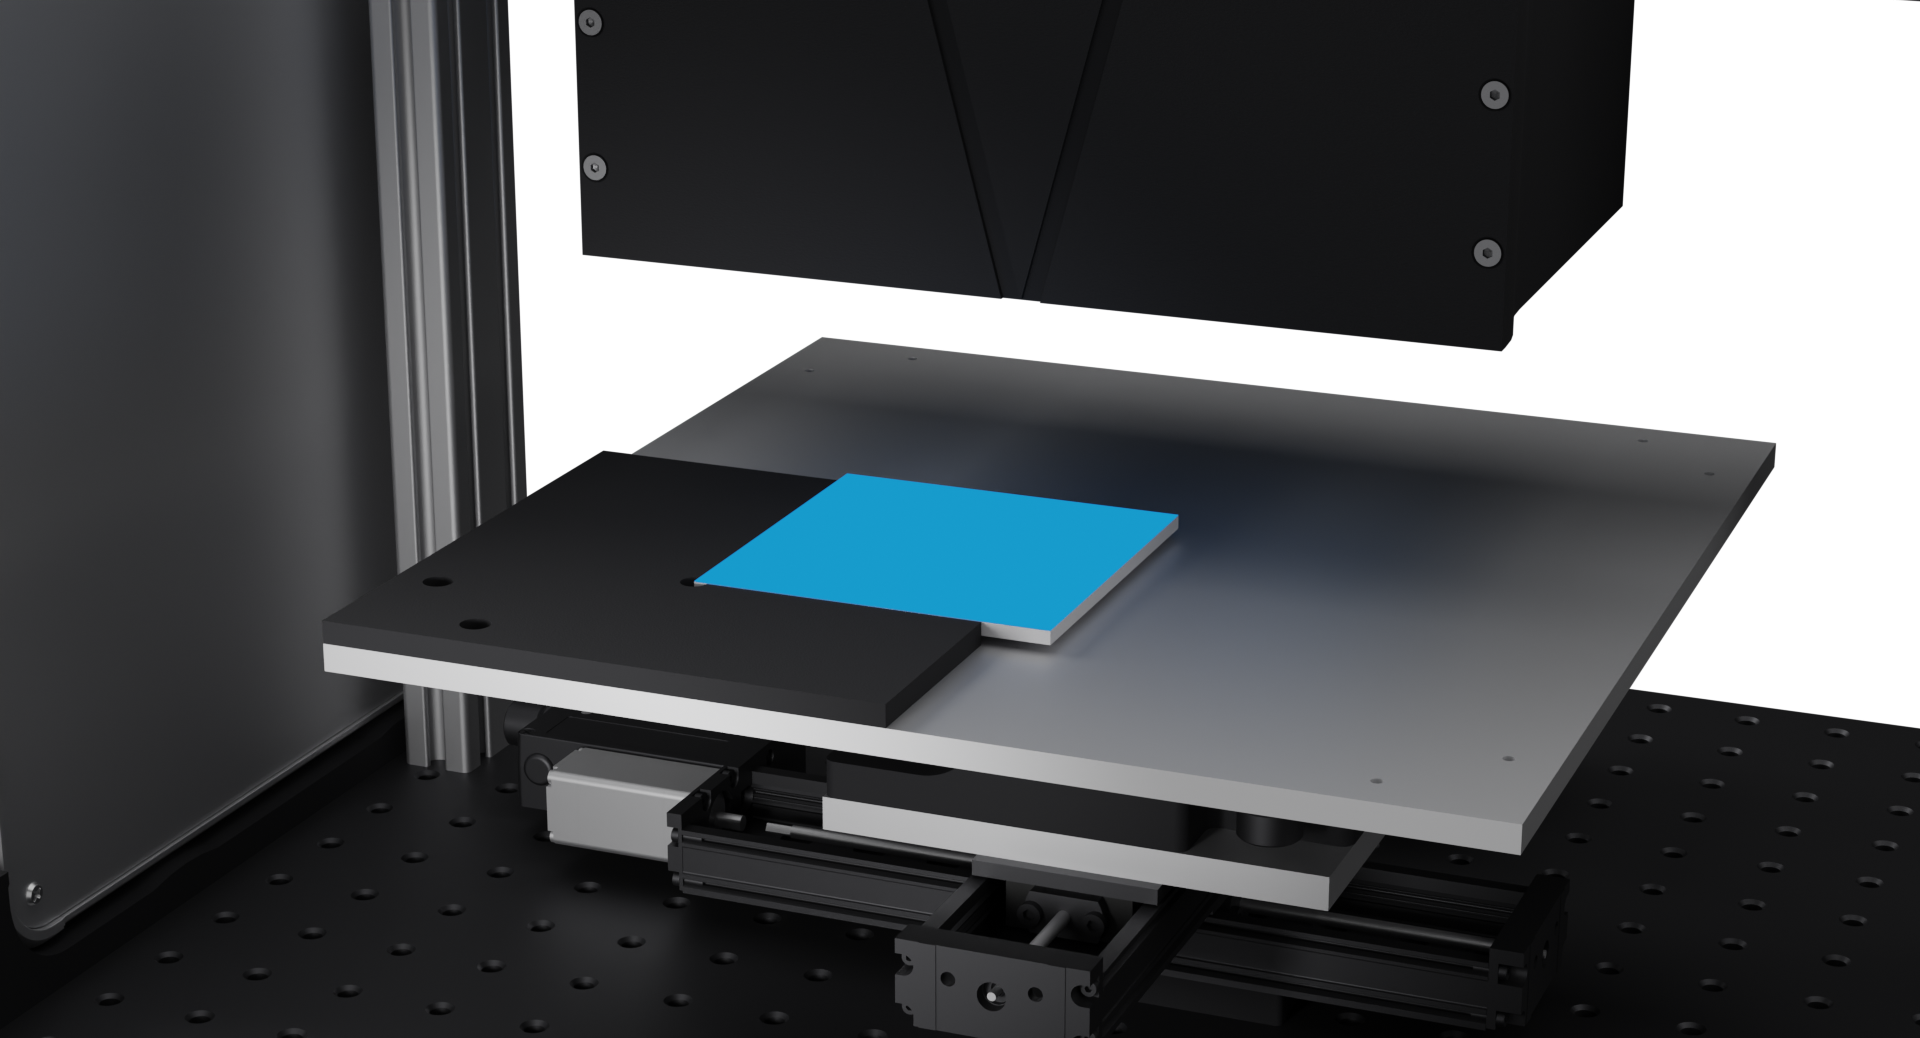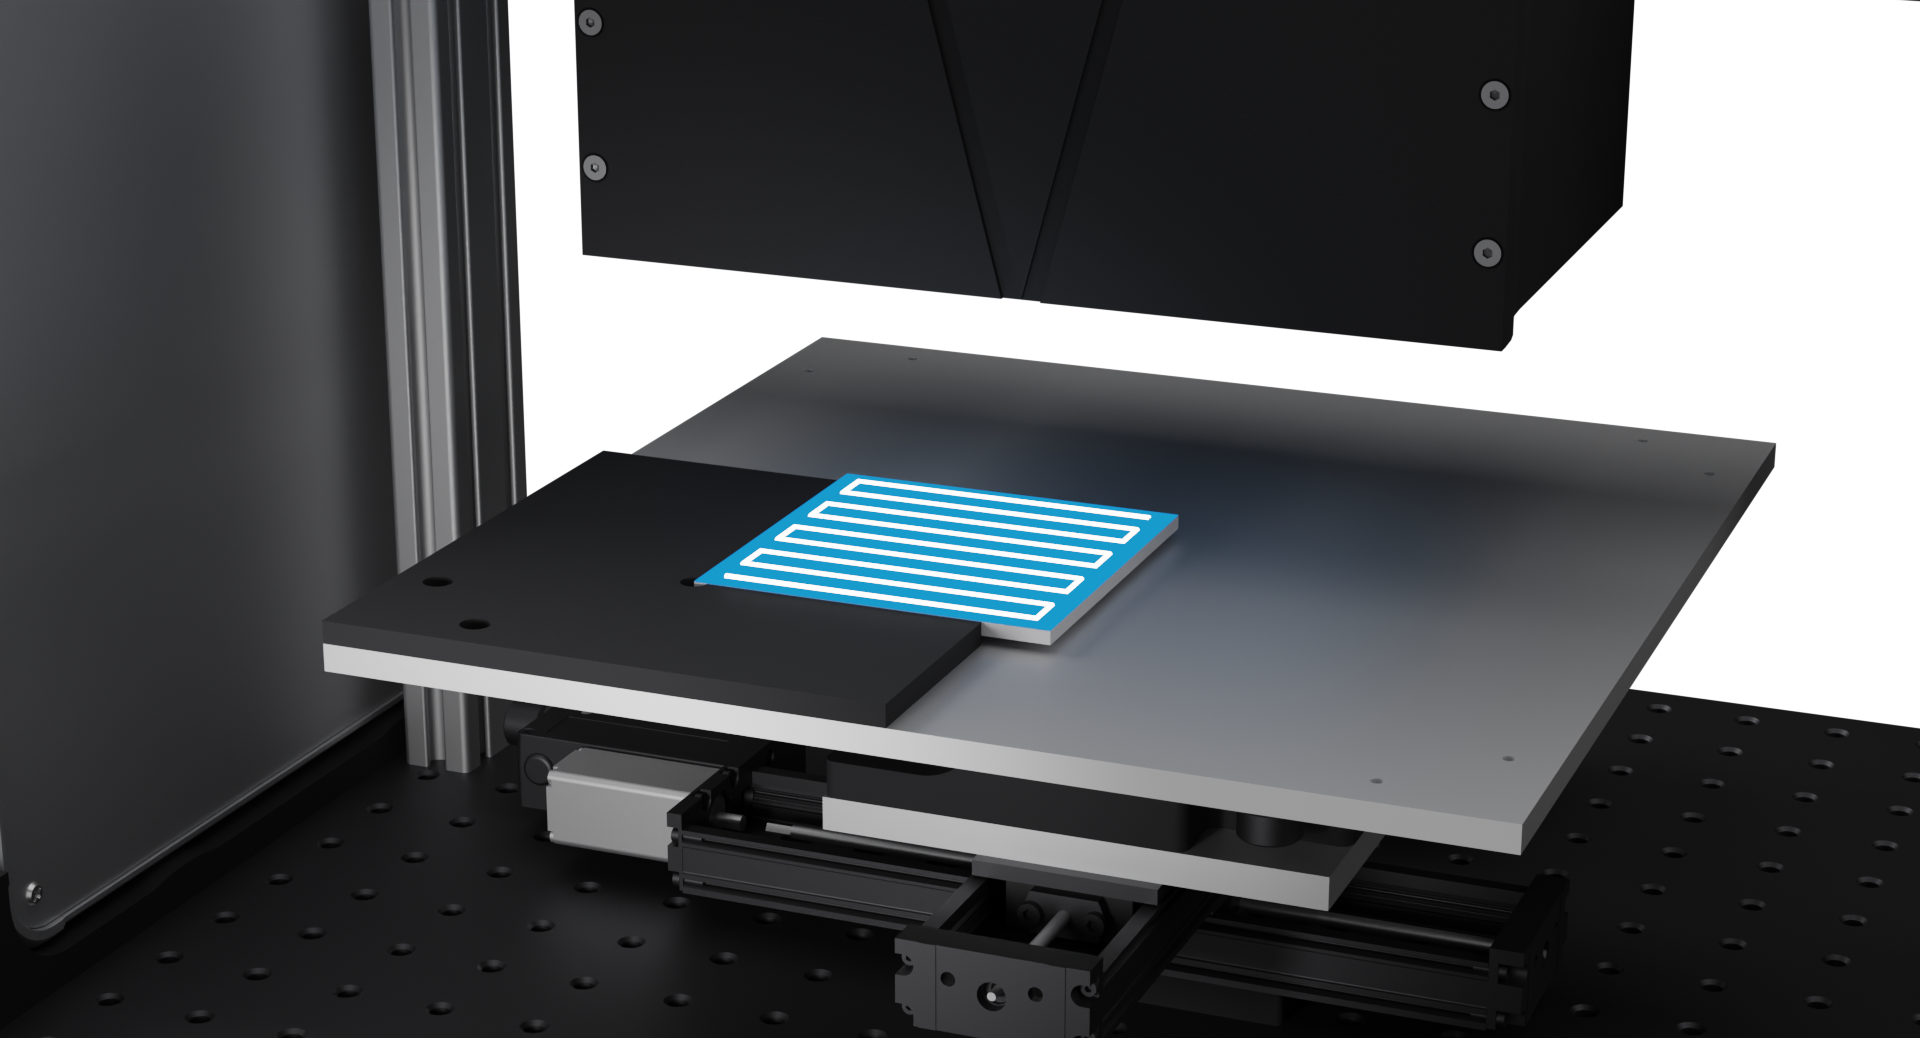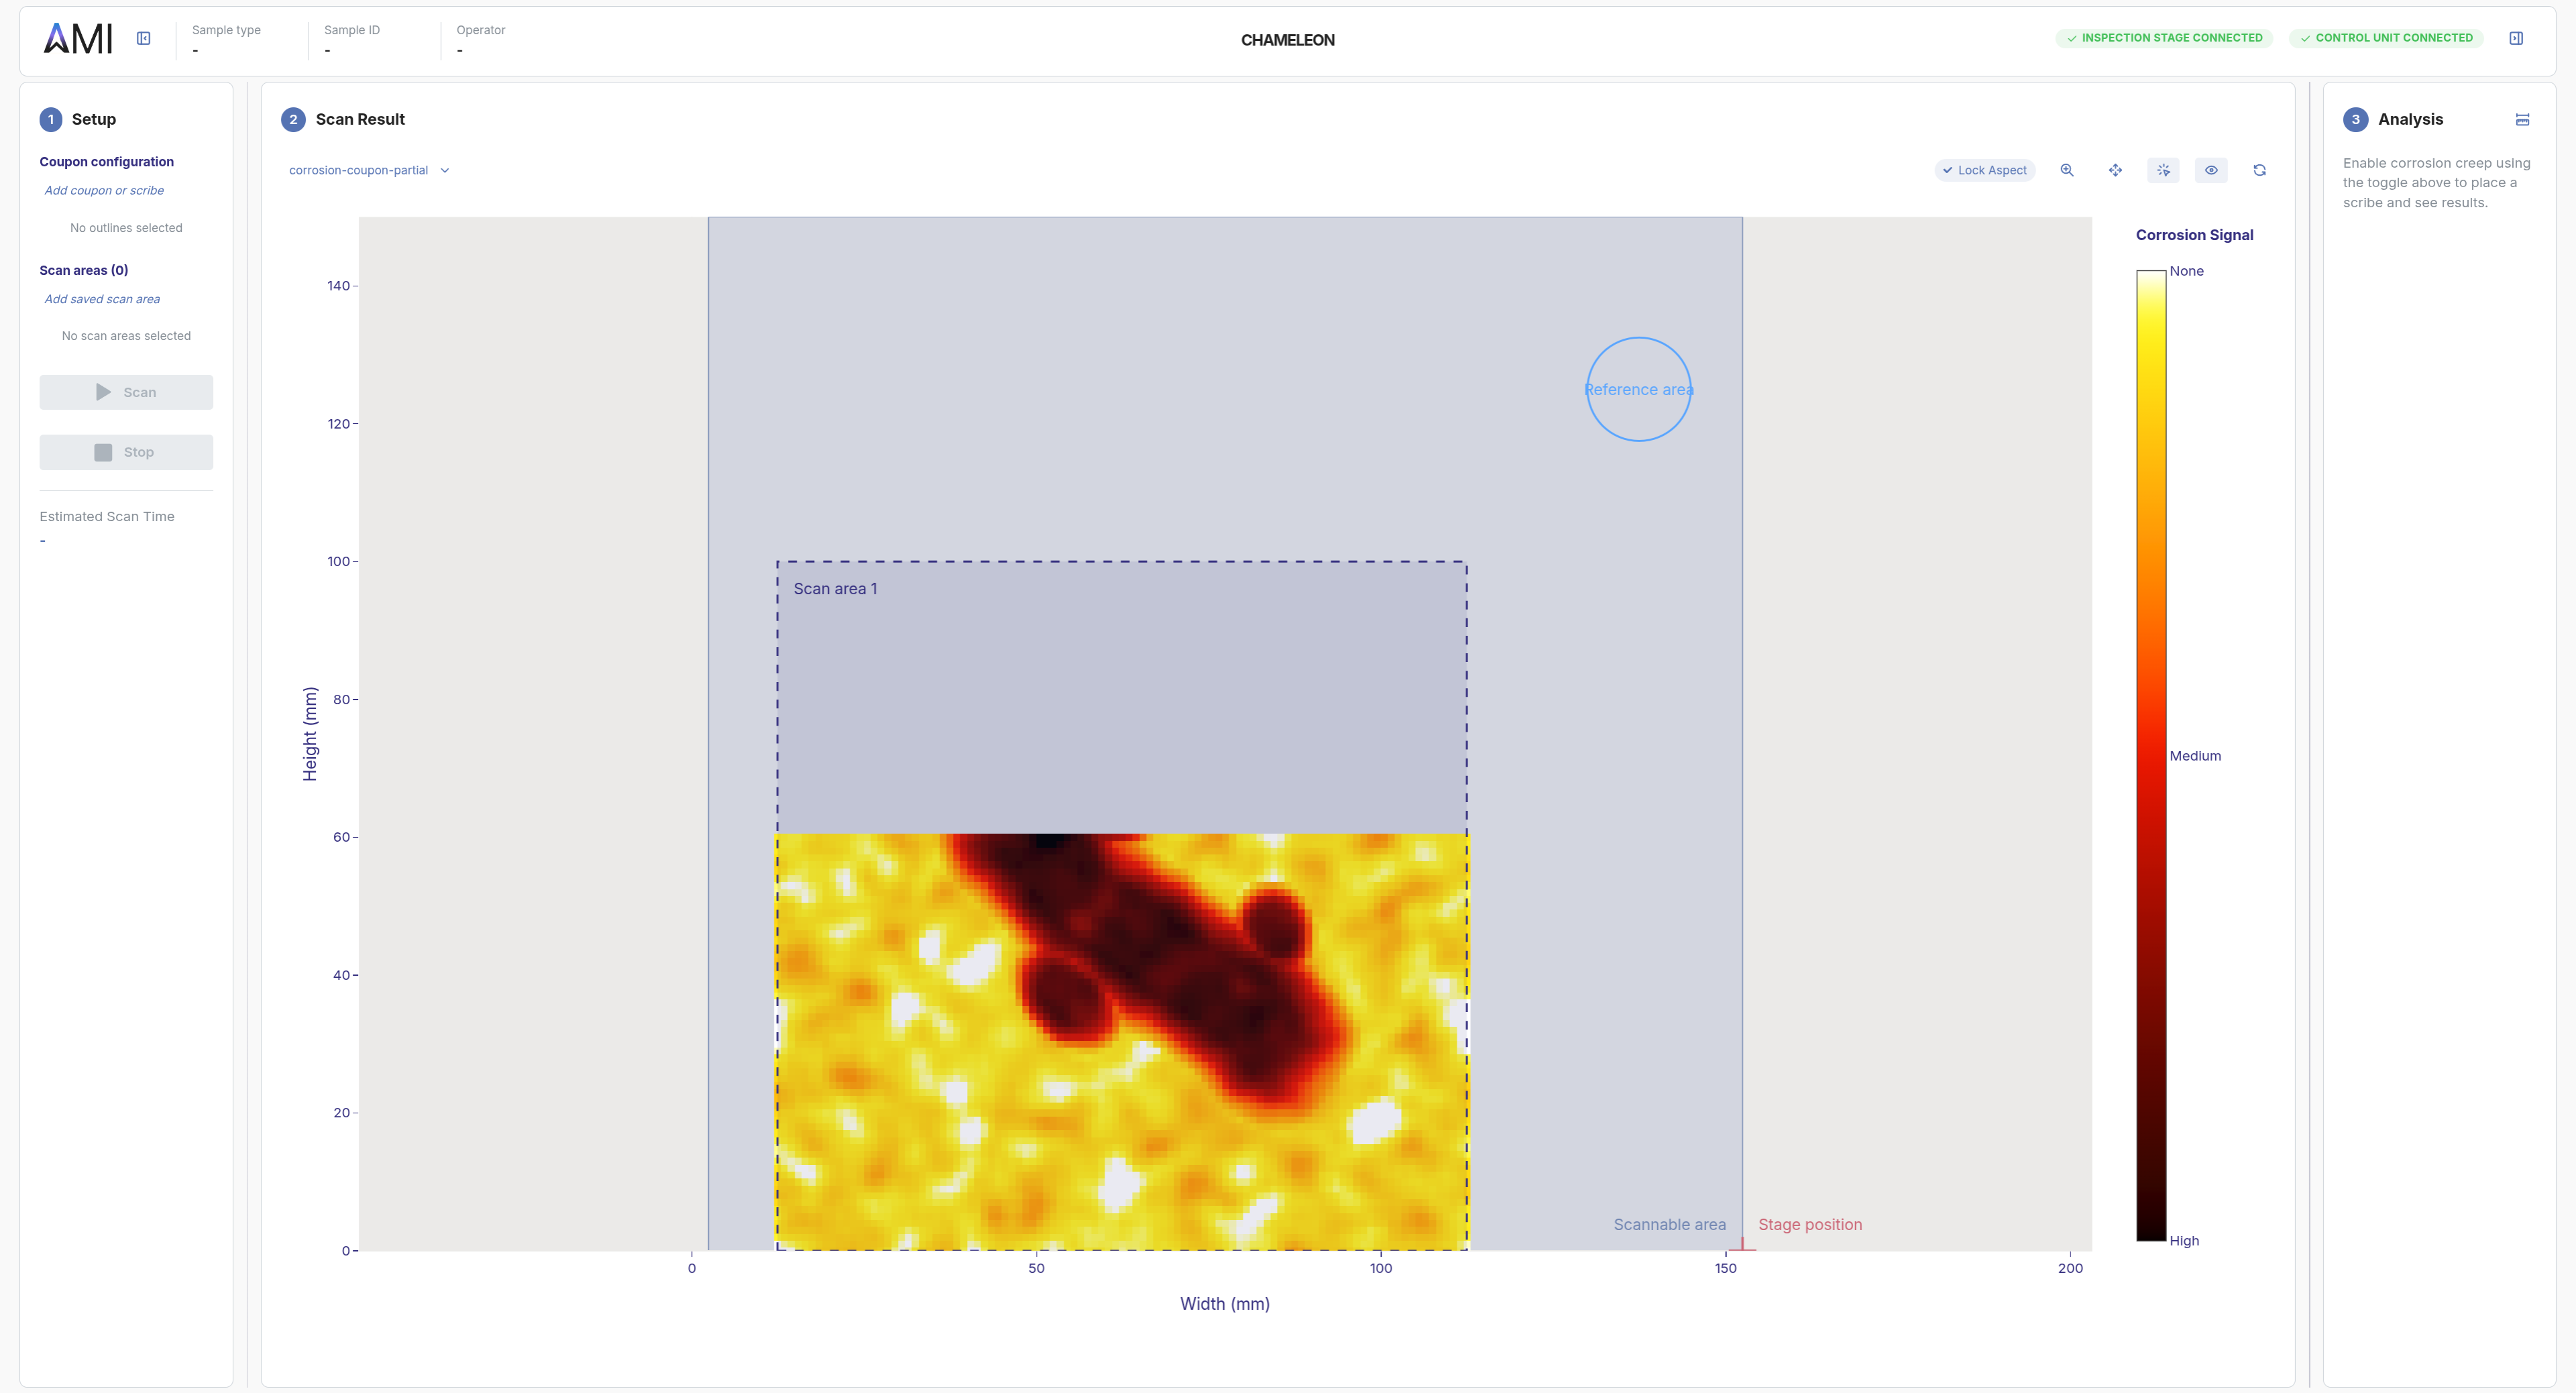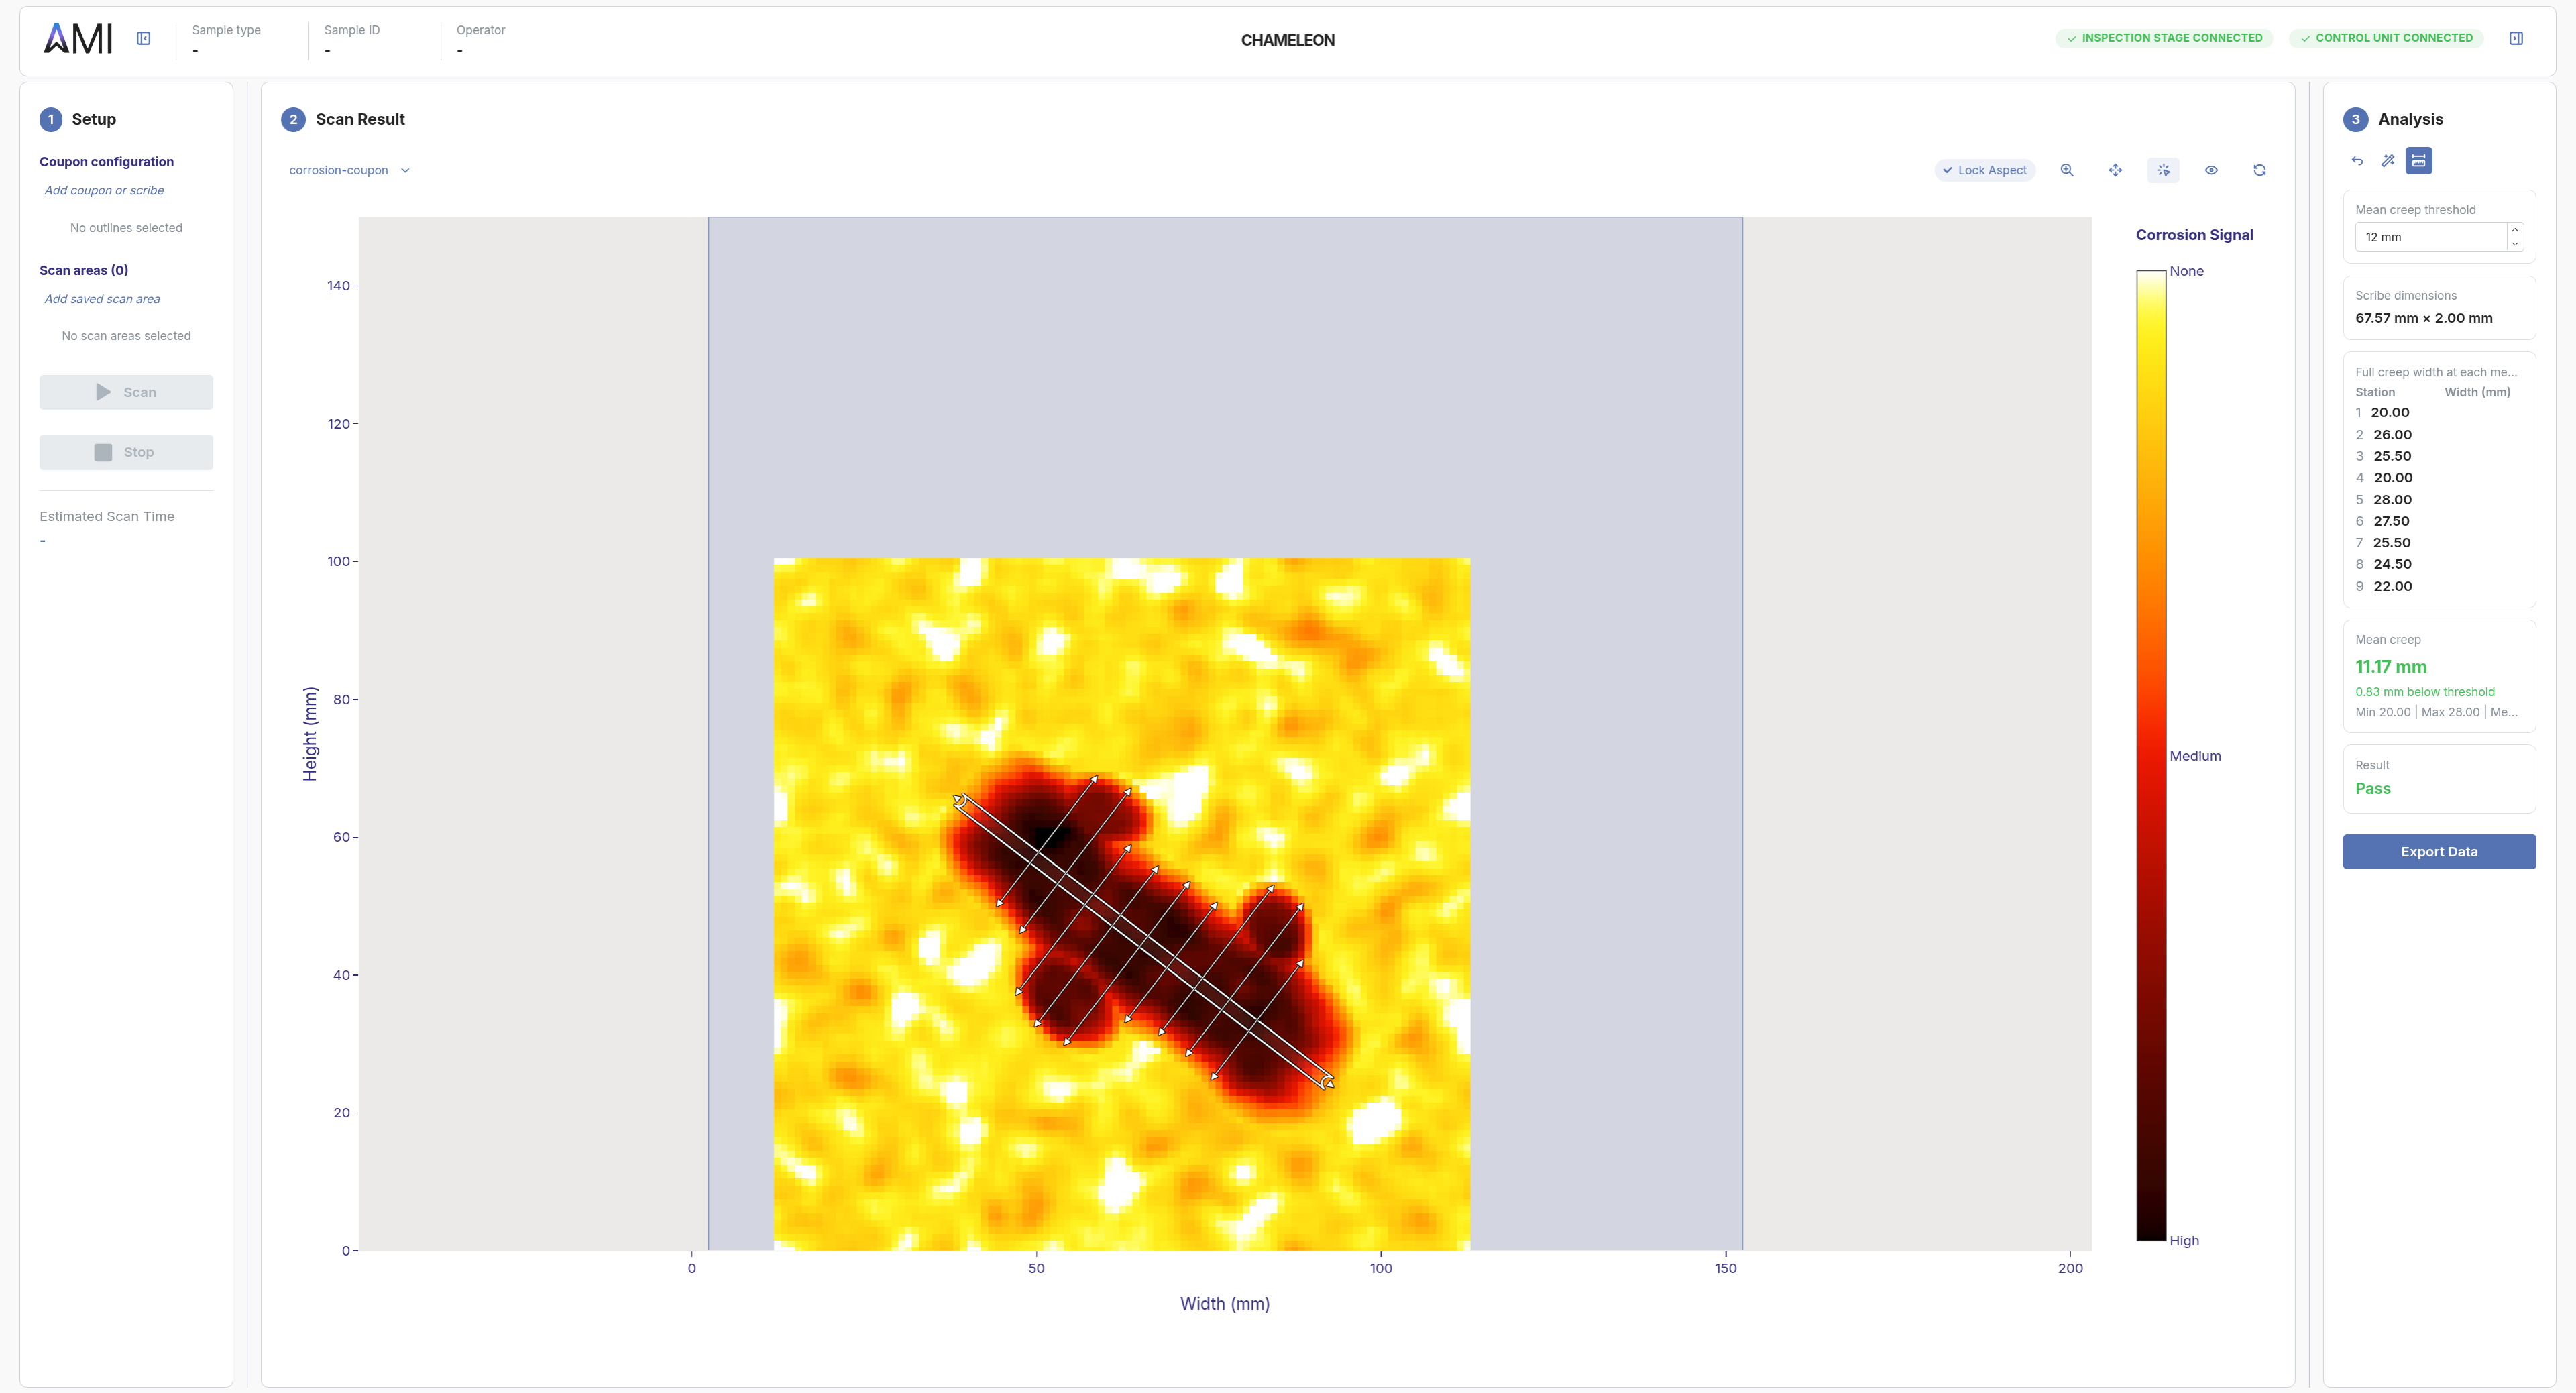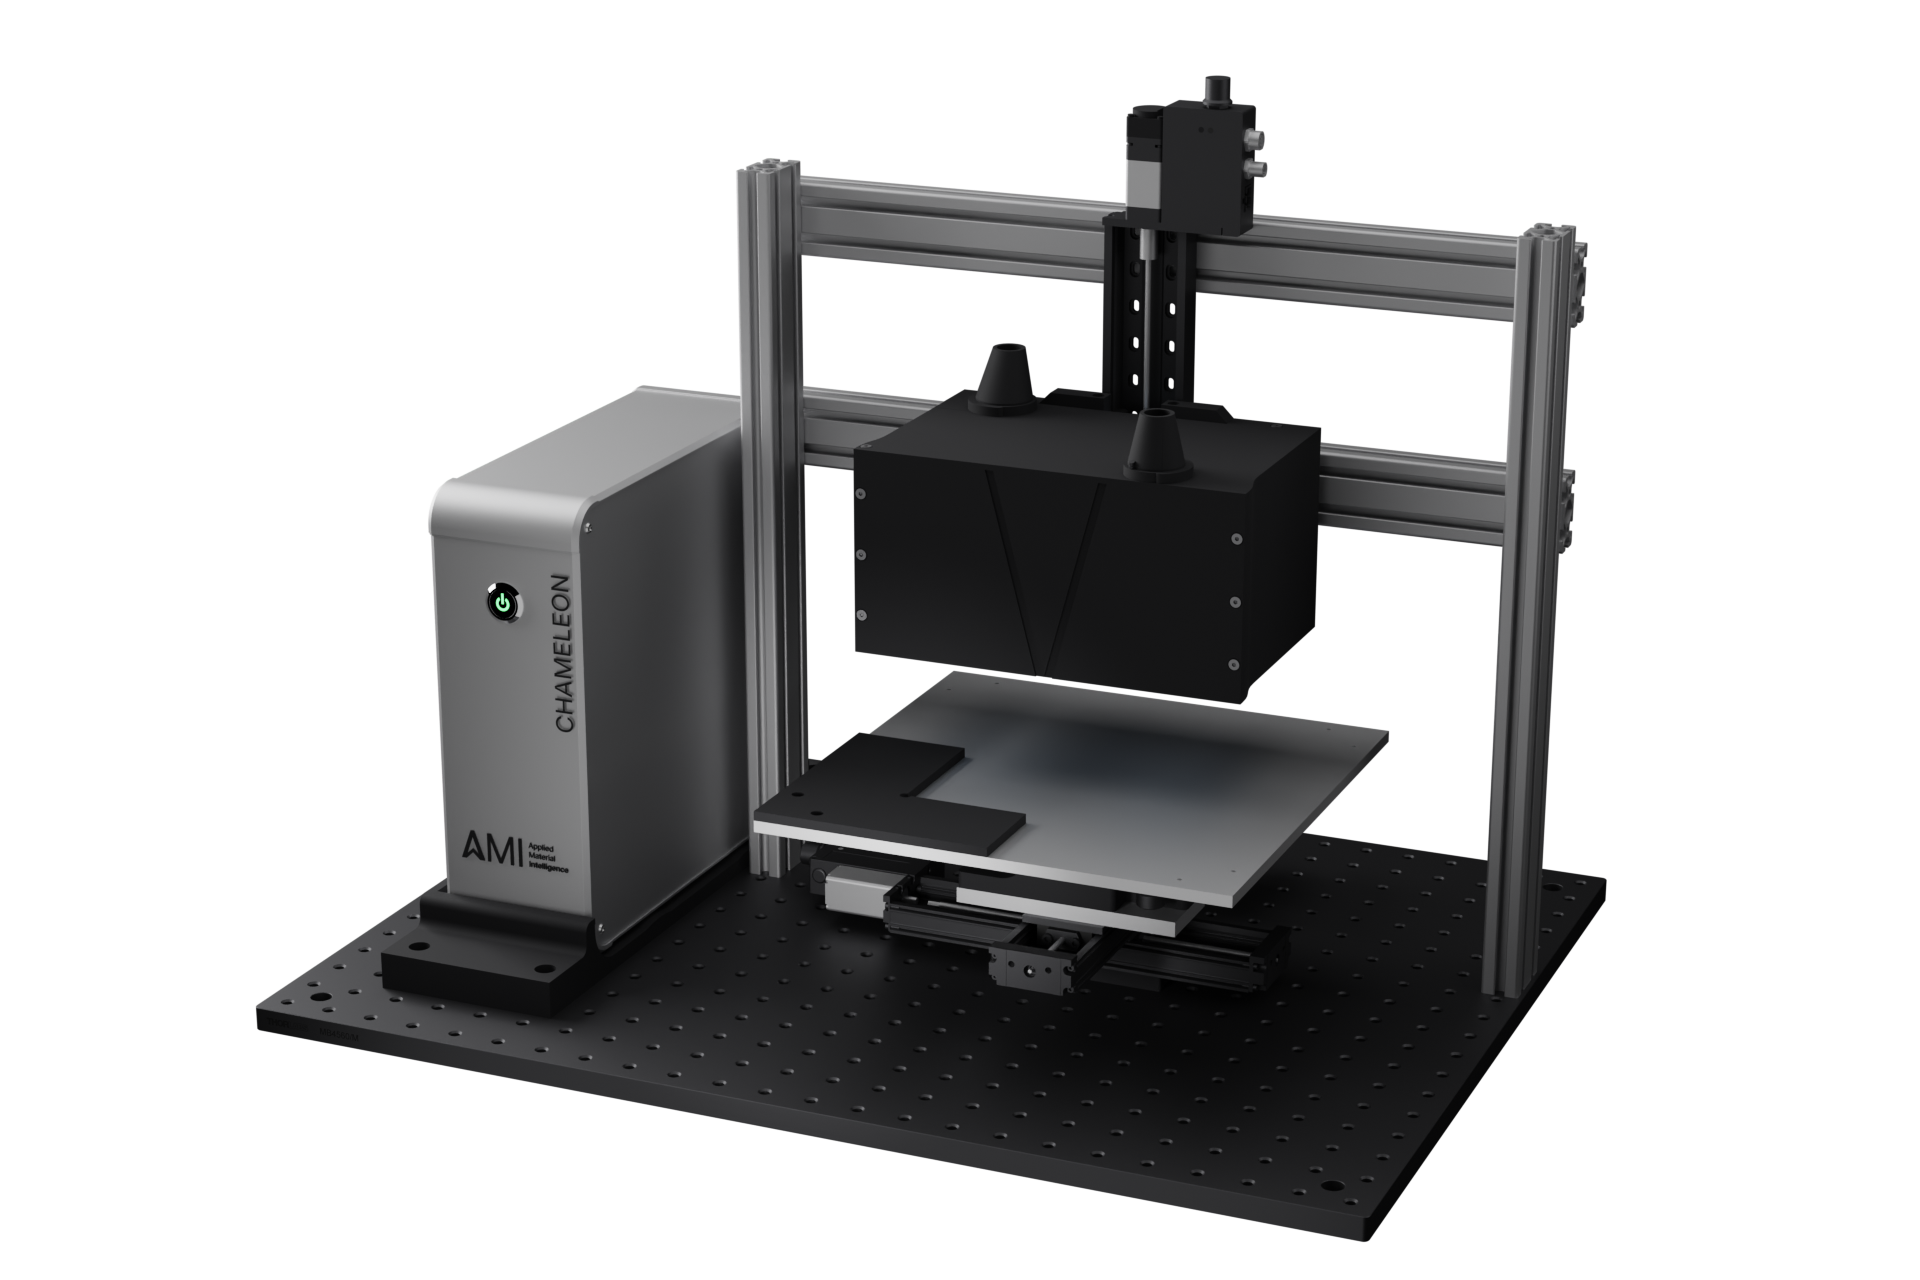
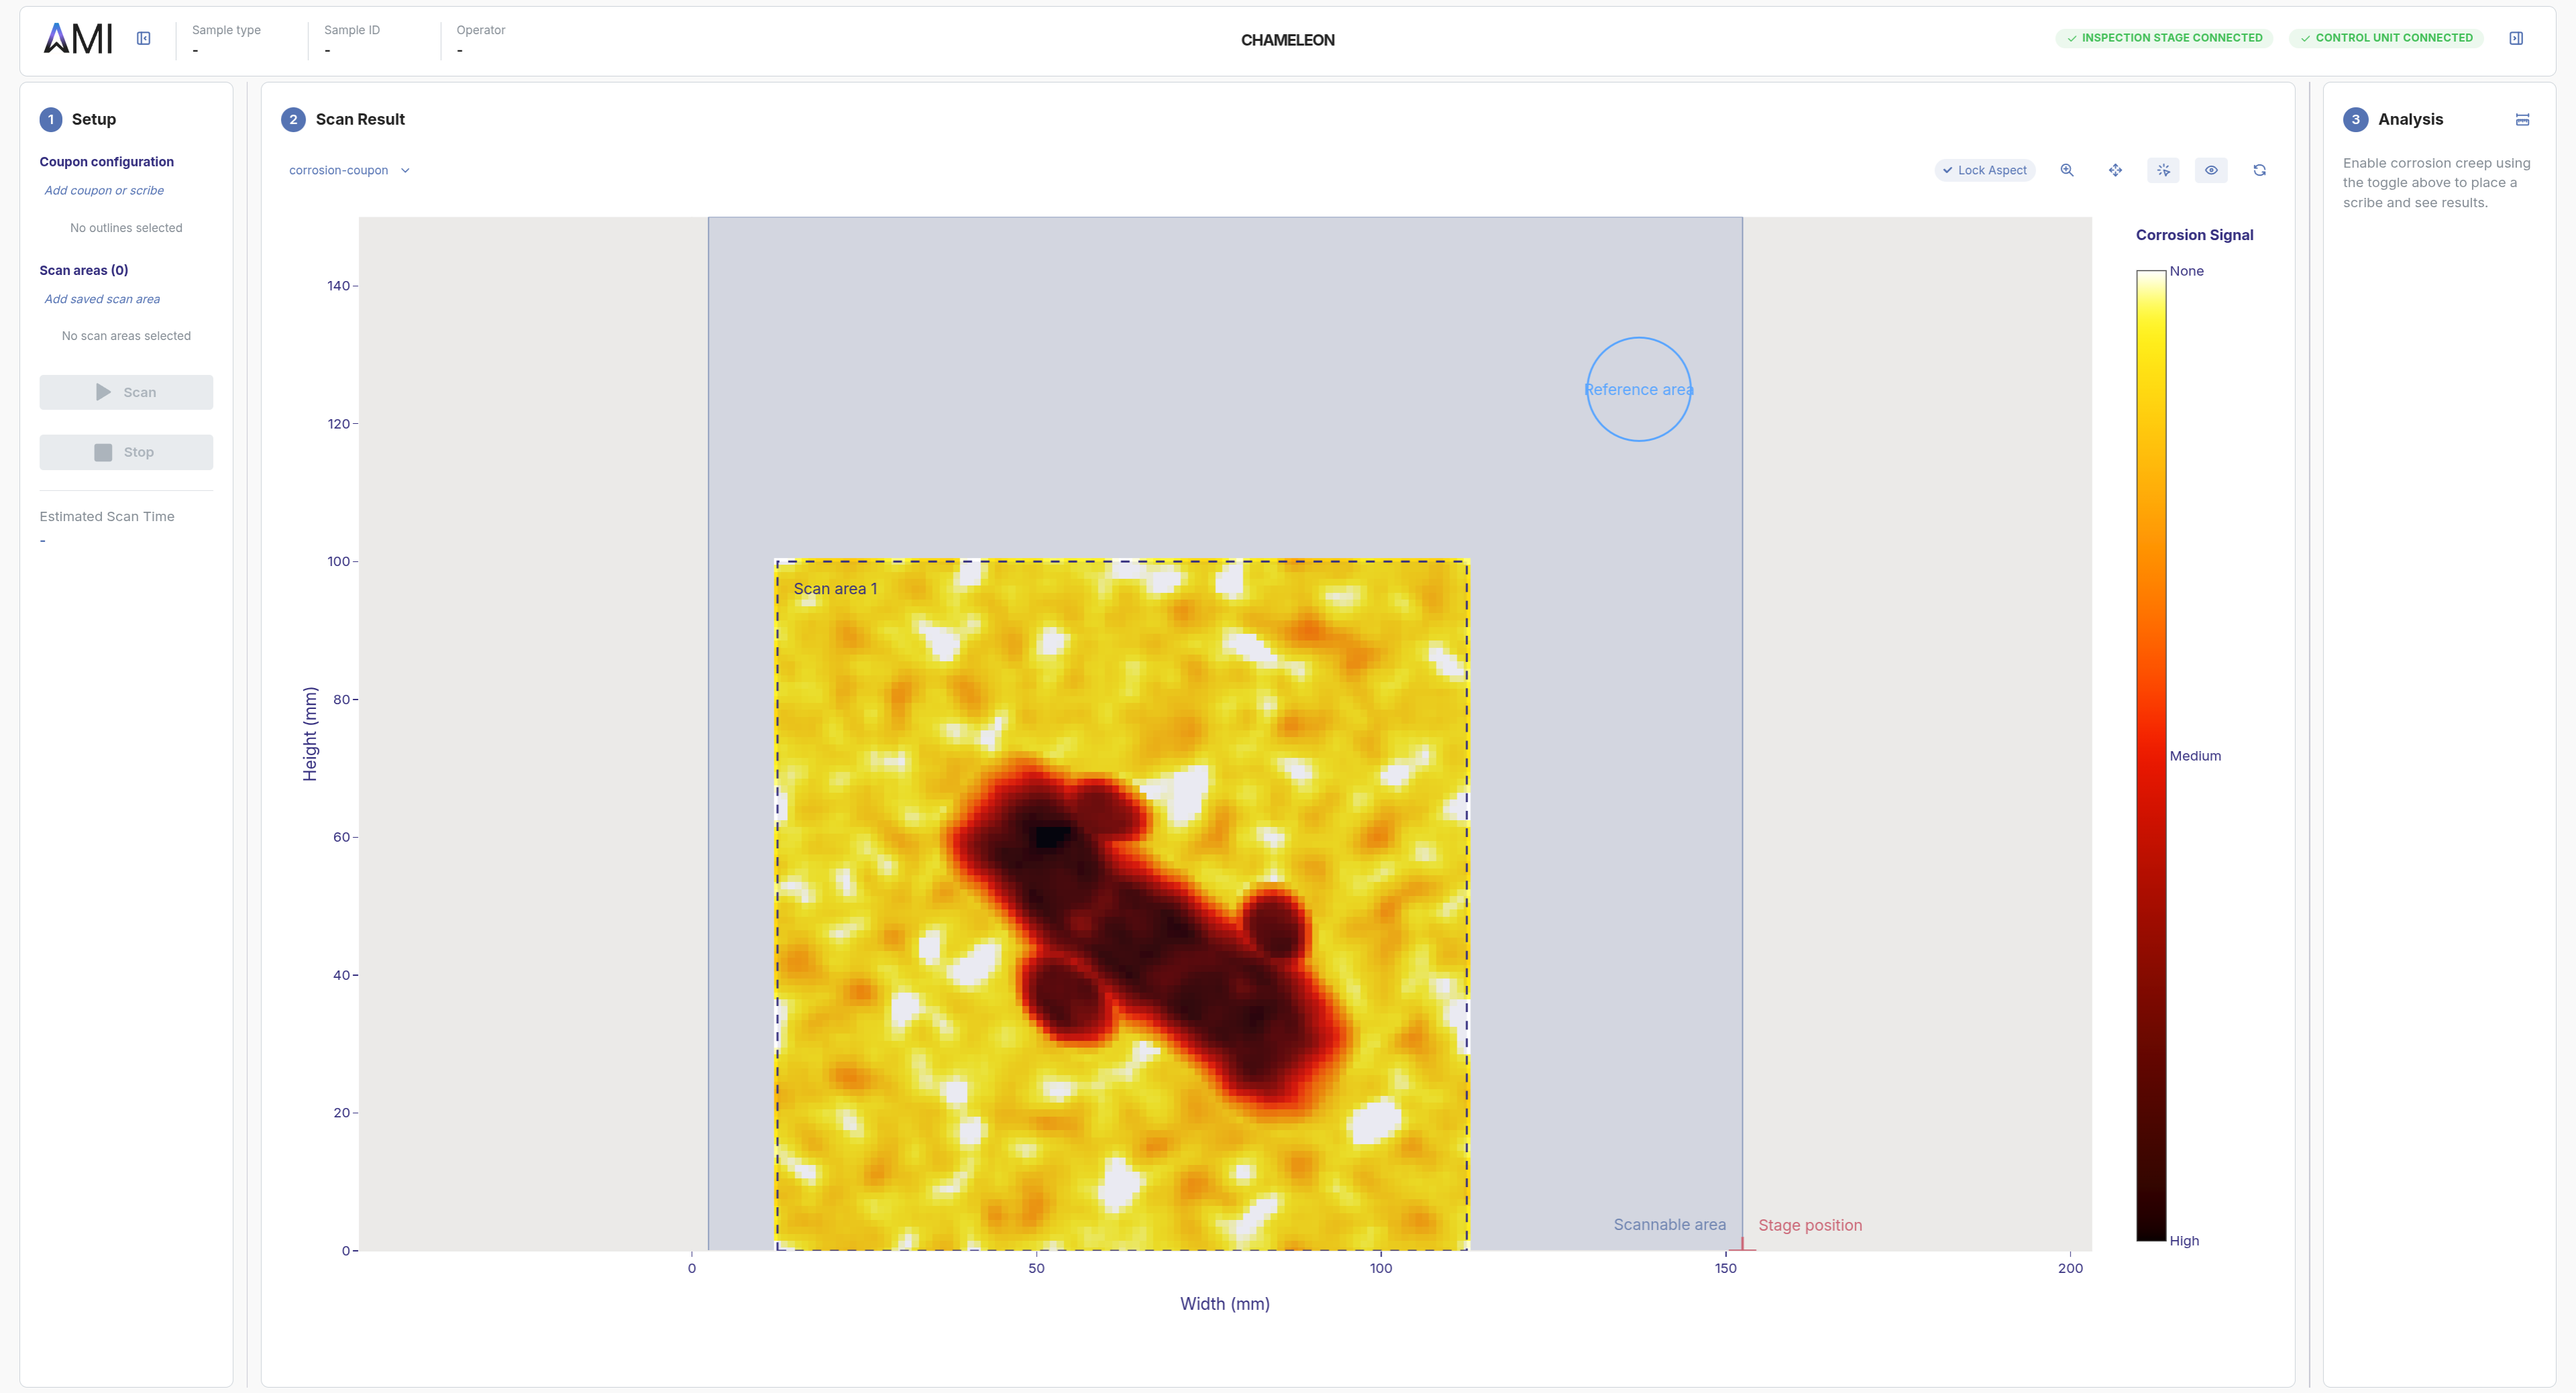
Made to fit your part
Each Chameleon ships with a sample holder shaped to your part, so your sample lands exactly where it needs to, every time. The holder mounts on a motorized 3D stage with ~20×20×10 mm of travel, extendable or shortened to match your application.